
In pursuit of FIRE, it’s not all about dreams of what to do with yourself when the time comes, as much as that’s the best part to consider. For better or worse, reality takes the front seat when determining how to get to early retirement, and the most important factor is figuring out how to accumulate enough money to afford it. Of course, the most common way to do this is by saving and investing as much as you can bear while you’re working.

But you likely don’t want to do this blindly if you have a specific retirement time frame in mind. A more prudent approach is to put together a rough estimate of how much you can expect your savings to grow so that you have a rough idea of the amount you need to invest to reach a target by a particular time. That is, if you think you need $2,000,000 to retire comfortably at 45, it’s helpful to come up with a plan to get there. And one factor – which may in fact be the most important – is the rate of return that you assume your investments will produce. While it’s impossible to predict the exact growth of your investments, setting reasonable assumptions goes a long way in getting you to where you need to be.
If you research historical stock market returns, you’ll have a difficult time finding a consensus on how the market has grown. Approximate returns vary depending on the benchmark used, the time frame, the inclusion of dividends, and whether you factor inflation into the returns. Generally speaking, most approximations of “stock market” returns look to the S&P 500 and the Dow Jones indices as indicative of overall market movement. But even when evaluating the same benchmark, there’s still variation depending on the person you ask. However, that doesn’t mean there isn’t enough information to come up with a reasonable approximation for anticipated future returns.
Poring over enough websites and performing enough of your own calculations – which I’m sure everyone will do – you’ll arrive somewhere in the ballpark of 6-10% for a given 20 to 30 year period.
Now, it’s tempting to consider the returns of the indices since their inception, which tend to land at around 10%. But remember, you have to consider what the likely return will be in the time frame in which you’ll actually be investing. If you’re 30 and hope to retire by 45, you’re looking more at a 20 to 30-year time frame than a 100-year time frame. I say 20-30 because you don’t need all your cash on day 1 of your retirement – it’ll continue to grow even as you spend it, but you still need to have enough to survive.
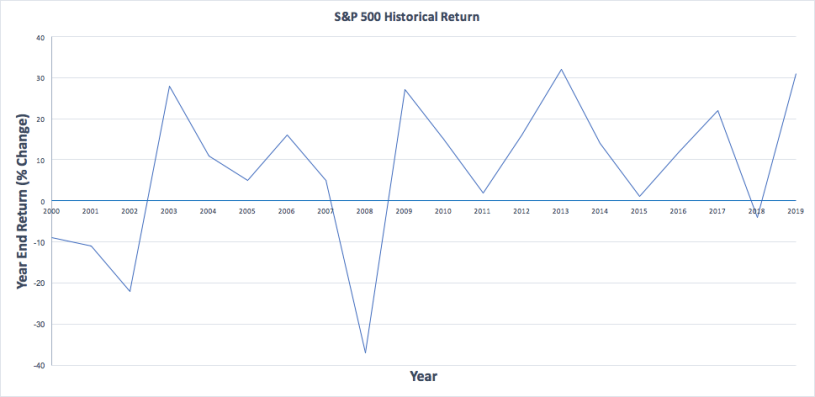
Remember too, that the shorter the time frame, the greater the volatility. Take a look at how the value of the S&P 500 has changed since 2000:
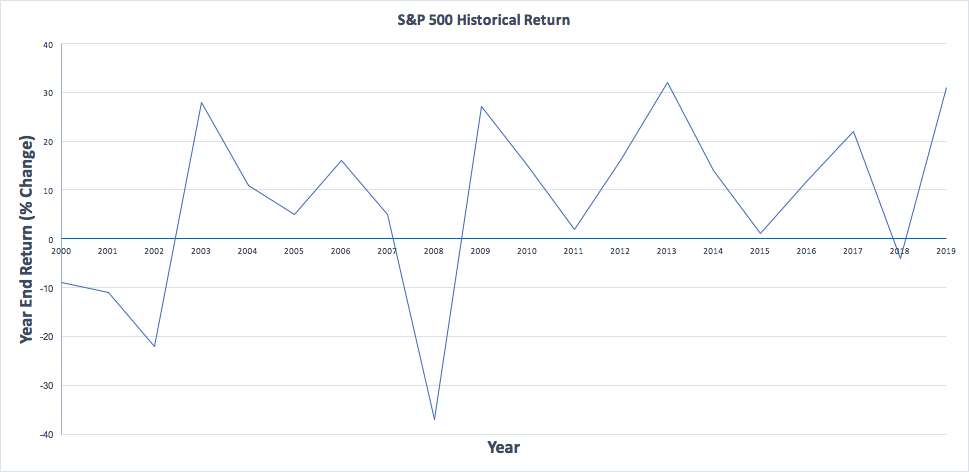
Although the total return for the 20 year period is about 6%, in any given year, the year-end return is all over the place. 2017 and 2018 are perfect examples. In 2017, the year-end return of the S&P 500 was about 22%, while for 2018, it was around -3.5%. While the stock market trends in the upward direction, it doesn’t do so in a straight line, but more like a fitful seismometer.
It’s for this reason that watching the stock market can play games with your emotions. One day, the market will shoot up 1% and you’re feeling great – you’re on track, your money’s growing, and you start searching for houses on the coast in Europe for the fast approaching day that you can walk out of the office for good.

The next day, the market sinks by 2%. You check your stock app and get nothing but a sea of red across the board. Each time you check it gets worse and panic mode grips you. You start being nicer to your colleagues, take on longer-term projects, turn your focus to business development – after all, you’ll never be able to retire, let alone early. And you’ll have to spend the entire rest of your life working plagued by the fact that you once had sizeable savings that you gambled away.
None of this is helped by the fact that the market seems to fall faster than it gains. A 1% gain is a pretty big day, while 2% dips seem to show up all the time, especially as the stock market grows and is subject to greater volatility. Look at March 2020, when the Dow achieved 4 records for the largest point drops in its history and single day percentage value slides greater than the one that started the 1929 Great Depression.
Look at fall 2008, when, well…you know what happened. But look what happened after those events. The market slogged its way back up. That’s the way the market can work: sharp declines and gradual gains. And anyone who panicked while the market was down and sold their stocks probably lost a chunk of their accumulated value when they missed out on the upswing, especially if they bought back in at higher prices.
Reading news about the market doesn’t help either. Go to any website that writes about the economy and market trends or however they brand themselves, and you’ll quickly notice the pervasive doom and gloom. “Acclaimed money manager says market can dip 10%”; “Hedge fund advisor says crash imminent”; “Chief economist at X bank says market overvalued and ready for correction”….and so on. There’s always a picture of a trader with his face buried in his hands.
Every so often you may get a positive article in the mix, just to keep readers interested, but the bulk tend to be negative: fear and panic draw eyes, and that’s how those sites make their money. The captivating headlines I love the most are those that say something in the nature of: “Man who predicted 2008 crash says another one imminent.” Saying that someone predicted a market downturn is about as useful as saying that someone predicted an earthquake. Some things are inevitable and there is little art in predicting them.
I can say, with confidence right now, that there will be an earthquake and there will be a market downturn in the future. That’s it, that’s my prediction. And in ten years, I’ll have been right at some point, but that doesn’t mean what I’ve said deserves any credence.

Every time I see someone quoted who allegedly says that the market is poised for a downward slide, I think, great, then you take your money out of the market and I’ll just keep sitting here. Honestly, do you think if someone truly had insight about a big shift in the market that they’d publicize it? No, they’d keep it to themselves and reap the profit.
The point of all this is to say that the market moves all over the place. It’s impossible (categorically) to predict with accuracy, even when such predictions are supported by troves of historic data. Historic returns are exactly that – historic, and looking forward anything can happen. But just because we can’t precisely predict how the market will change, we can use historic returns as rough guidelines – that’s exactly what the billion-dollar trading algorithms used by the powerhouse financial firms do. Though they’d probably take issue with the word “rough”.
The reason I give some credit to evaluating historic returns is two-fold: (1) we don’t really have anything better to use; and (2) future returns mimicking past returns can tend to be a self-fulfilling prophecy. Huh? It goes something like this. If historically the market returns 10% on average over a certain time frame, when it starts to exceed that, traders and trading algorithms may start to think that the market is reaching a peak and that higher value portends an inevitable downturn. So, what do they do? They start to sell off to capture gains, and then, you have your downturn. So just by thinking that a downturn is likely, the downturn comes.
The same phenomenon happens when the market turns south – if traders and algorithms think the bottom is near and has passed, they’ll start to buy, and there’s the upturn. In a way, this is why over the long run, average returns experience similar trends. If you want to read more about this, research something called “resistance” and “supports,” but I won’t bore you with the details here. If you decide to become a full-time day trader, concepts like resistance and supports will be burned in your brain, but for longer-term investors they have less significance. And I’ll add the caveat that this is a momentous over-simplification of how the market works – certainly there are traders who outperform (and underperform) the market, and there are times when returns burst through averages and keep a steady path despite what history suggests.
Given everything discussed above, how do you pick your expected rate of return to project the value of your holdings at a given time in the future? This is extremely important, especially as you try to predict how much your savings will grow as you pursue early retirement. The worst-case scenario is that you run out of money at some point and have to drag yourself back to the grind, especially if you’ve aged yourself a number of years, as people tend to do.
Selecting a Rate of Return
Because of the downside risk of overestimating future net worth, and in light of the volatility of the market, my personal preference is to err on the conservative side when selecting an anticipated rate of return. This is solely for protection. It’s much easier to assume a lower return and work longer now to hit a savings goal than to overestimate the return rate only to run out of money later and have to find a decent-paying job when you’re 70. And, if your returns are higher than you project, great! That’s more money and greater security over the long-term.
Is the anticipation killing you yet? Do you watch those cooking competition shows and slide to the edge of your couch during the dramatic pause before you find out who’s being eliminated? Well, you shouldn’t, because you could just scroll to the bottom of the article. I use 6% as the starting point for all my projections of return on equities (stocks). Why? It’s on the lower end of the historical returns, even factoring in inflation. It’s conservative but not overly so and if you assume this, few people will tell you’re overestimating. It’s a good, safe number to start with, and you can always revisit later on. Is it guaranteed? NO!!! But, it’s not unreasonable, in my opinion.
Remember, I’m not assuming that at the end of each year, my portfolio will be a neat 6% higher than the previous year. I’m assuming that in 30 years, looking back, it will have grown by a annualized rate of 6%, consisting of years where it grows by 15%, 3%, 18%, 7%, and years where it declines by 4%, 7%, 15%, etc.
In other posts, I’ll provide examples of projections and you’ll see that the 6% assumption requires some adjustment, and I’ll explain where that happens. As one example, when projecting the growth of a 401(k), consider that most people put their 401(k) investments into a target-year fund. That is, the employee can choose their target year for retirement and the fund manager adjusts the portfolio as time progresses. With 30 years to go, most of the investments will be held in equities to seek a higher return while the investor can tolerate larger fluctuations in the market. As the target date approaches, the fund will shift to more conservative investments like bonds that have less volatility and more stable (albeit lower) returns. The theory behind this is that a 65 year old needs more certainty than a 35 year old because there’s a shorter time frame and the 65 year old actually plans to live off the money in the account. So, if projecting the future returns for a target date 401(k), the rate has to taper lower as the retirement date approaches to account for this shift in assets.
Give it some thought and use what feels most comfortable for you. Everyone has different risk tolerances and different conceptions of what the future will hold.
